Twenty electric cars have now been driven over the same 93 kilometre route near Geelong by a federally funded testing programme, and every single one came in under its laboratory range figure. The shortfalls run from 3 per cent to 31 per cent.
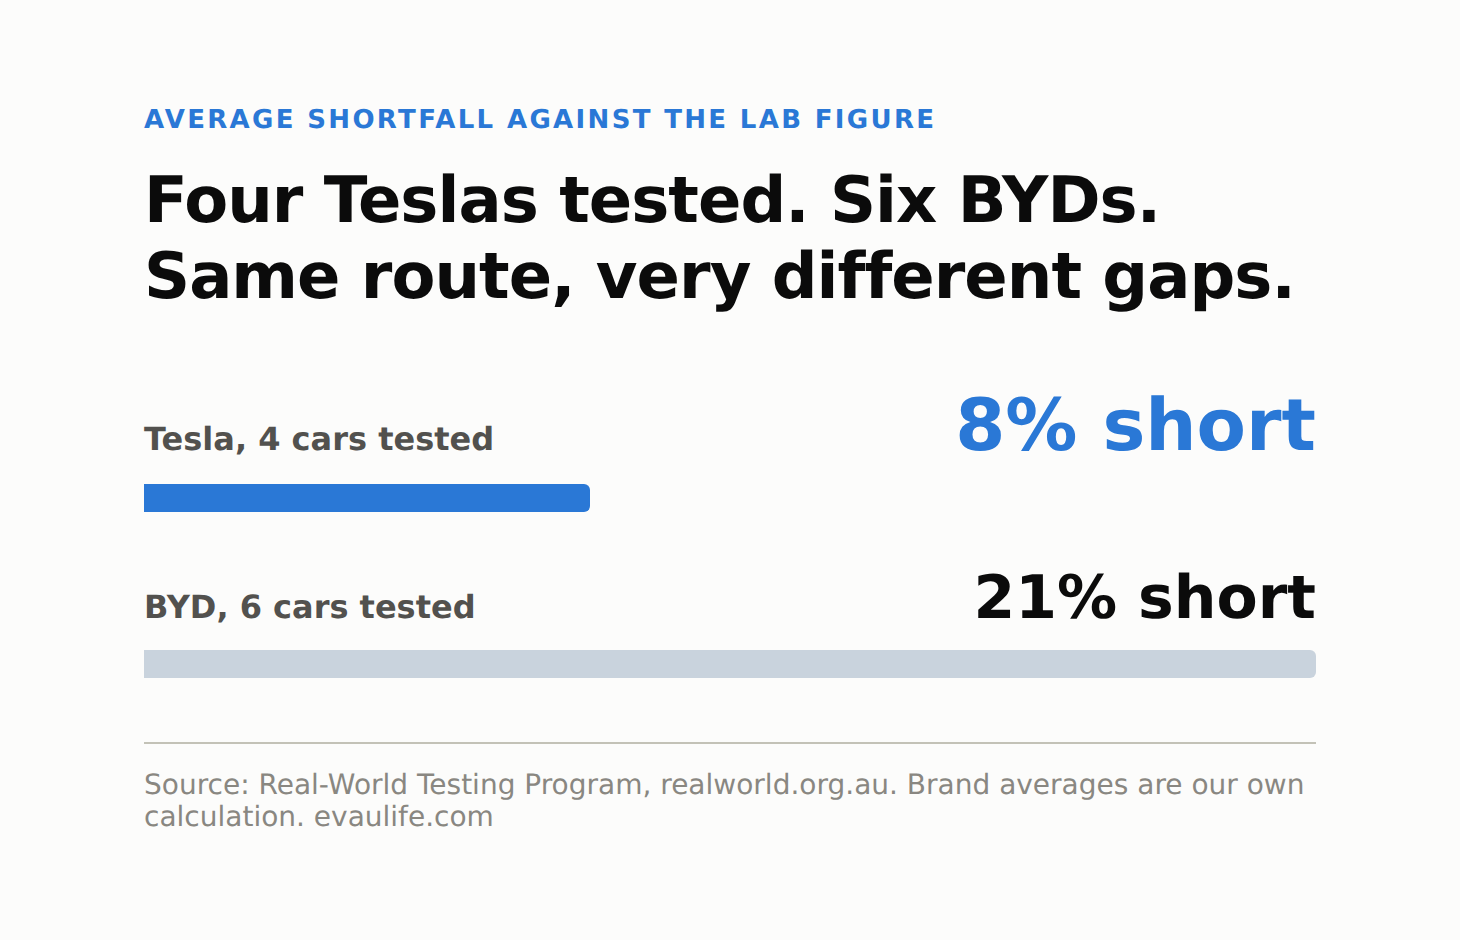
That spread is the story. If every car missed by the same margin you could just knock a fixed percentage off the brochure and move on. They do not. One brand averages 8 per cent across four cars tested. Another averages 21 per cent across six. Knowing which is which changes what you should buy.
This is what the independent evidence on electric car range Australia has says, and there is not much else like it.
On this page
- Somebody is finally measuring this on Australian roads
- Every result the programme has published
- The pattern by brand, which nobody has published
- Why the lab figure is so optimistic, and why two brochures may not be comparable
- What electric car range Australia gives you in practice
- What the measured numbers mean for a normal week
- Consumption is the number that costs you money
- What to do with all this
- Common questions
Somebody is finally measuring this on Australian roads
The Real-World Testing Program is run by the Australian Automobile Association and paid for by the federal government. It exists because of the 2015 Volkswagen emissions scandal, which showed how far a laboratory result can drift from what a car does on a road.
The method is deliberately dull, which is the point. Every car drives the same 93 kilometre loop in and around Geelong, mixing urban, rural and motorway sections. Electric cars run the loop twice, then get recharged in a temperature-controlled chamber through a 22 kW AC home charger while a power analyser records how much electricity actually goes in. The whole thing is repeated at least twice per car and the published figure is the average.
That recharging detail matters more than it sounds. Measuring the electricity that actually goes into the car, rather than reading a number off the dashboard, is what makes the consumption figures worth anything.
Every result the programme has published
Here are all 20, ranked by how close each car came to its lab figure.
| Car as tested | Lab range | Measured | Shortfall | Real consumption |
|---|---|---|---|---|
| Tesla Model Y RWD 2025 | 466 km | 450 km | 3 per cent | 148 Wh/km |
| Kia EV5 Air 2WD Long Range | 555 km | 537 km | 3 per cent | 185 Wh/km |
| Smart #3 Premium | 455 km | 432 km | 5 per cent | 170 Wh/km |
| MG S5 RWD Essence 62 | 425 km | 399 km | 6 per cent | 183 Wh/km |
| Tesla Model Y Long Range AWD 2025 | 600 km | 559 km | 7 per cent | 151 Wh/km |
| Kia EV6 Air | 528 km | 484 km | 8 per cent | 166 Wh/km |
| Tesla Model Y Long Range 2024 | 533 km | 490 km | 8 per cent | 167 Wh/km |
| BMW iX1 xDrive30 | 400 km | 360 km | 10 per cent | 189 Wh/km |
| Kia EV9 Air RWD | 443 km | 395 km | 11 per cent | 199 Wh/km |
| Kia EV5 Earth AWD Long Range | 500 km | 446 km | 11 per cent | 219 Wh/km |
| Kia EV3 Air Long Range | 604 km | 537 km | 11 per cent | 164 Wh/km |
| Smart #1 Pro+ | 420 km | 367 km | 13 per cent | 203 Wh/km |
| Tesla Model 3 RWD | 513 km | 441 km | 14 per cent | 140 Wh/km |
| BYD Sealion 7 Premium | 567 km | 469 km | 17 per cent | 199 Wh/km |
| BYD Dolphin Premium | 490 km | 398 km | 19 per cent | 177 Wh/km |
| BYD Atto 3 Essential 2025 | 410 km | 328 km | 20 per cent | 171 Wh/km |
| BYD Atto 3 Extended Range 2023 | 480 km | 369 km | 23 per cent | 180 Wh/km |
| BYD Dolphin Essential | 410 km | 313 km | 24 per cent | 163 Wh/km |
| BYD Seal Premium | 650 km | 488 km | 25 per cent | 188 Wh/km |
| MG4 Excite 51 | 405 km | 281 km | 31 per cent | 200 Wh/km |

The AAA has never published an average across these results, and it would be wrong to attribute one to it. Working it out from the published figures, the mean shortfall across all 20 cars is 13 per cent and the median is 11 per cent. If you want one number to knock off a brochure figure, 11 per cent is the fairer of the two, because the mean is dragged up by a handful of poor results.
The pattern by brand, which nobody has published
Sort that table by badge and something jumps out. These are our calculations from the programme’s own results, not figures the AAA publishes.
| Brand | Cars tested | Average shortfall |
|---|---|---|
| Tesla | 4 | 8 per cent |
| Kia | 5 | 9 per cent |
| Smart | 2 | 9 per cent |
| BMW | 1 | 10 per cent |
| MG | 2 | 19 per cent |
| BYD | 6 | 21 per cent |
Six BYDs have been through the route and the best of them missed by 17 per cent. Four Teslas have been through it and the worst missed by 14 per cent. That is not one bad car, it is a consistent difference in how close the advertised figure lands.
Two honest qualifications. MG’s average rests on two cars, one at 6 per cent and one at 31 per cent, so the 19 in that column is the midpoint of two results with nothing in common. The 31 is a discontinued variant and the worst result in the whole dataset. Treat that row as an artefact of a tiny sample. And part of the BYD gap comes from which number the brand declared rather than from how the car drives, which takes a section of its own to explain.
Why the lab figure is so optimistic, and why two brochures may not be comparable
Two things are going on.
The first is what a laboratory range test actually simulates. Polestar spells it out on its own Australian website more clearly than anyone: the WLTP figure “measures the range, travelling at an average speed of 46.5 km/h in summer temperatures from a 100% to 0% state of charge”.
Read that again. An average of 46.5 km/h, in summer, from completely full to completely flat. Nobody drives like that. A Hume Highway run at 110 km/h is more than twice that average speed, and aerodynamic drag rises with the square of speed. A July morning in the Southern Highlands is not summer temperatures. And running a battery to zero is something you will spend your whole ownership avoiding.
That is the WLTP cycle. The older NEDC cycle, which is still behind a lot of Australian claims, averages about 33 km/h. Gentler again.
The second thing took some digging, and it is the part that should change how you read a brochure.
Every result page on the programme’s site carries the same footnote. The lab figures are “measured in accordance with the Australian Government’s regulated standard, Australian Design Rule 81/02”. One standard, all 20 cars. The words WLTP and NEDC appear nowhere on the site.
But ADR 81/02 does not mean the programme ran its own laboratory test. It means the figure came from what the manufacturer declared, and manufacturers have not all declared the same kind of number.
Take two cars from the table. Kia advertises the EV3 Air Long Range at 604 km and footnotes it “Figures based on WLTP”. The programme’s lab figure for that car is 604 km. BYD’s own Dolphin spec sheet lists the Premium at 490 km NEDC and 427 km WLTP, and BYD’s website now leads with the 427. The programme’s lab figure for that car is 490 km.
Same footnote, same declared standard, and one of those two cars is being marked against a number 63 kilometres more generous than its own maker currently advertises.
This is not the programme hiding anything. The problem sits upstream, and the government says so itself. The Green Vehicle Guide, which is where those declared figures live, notes that a field recording which test procedure a vehicle was measured under was only added in 2026, and that “Vehicle data supplied before this date may not distinguish the test procedure used”.
So some of the brand pattern above is engineering and some of it is paperwork, and from outside you cannot cleanly separate the two. Australia is midway through fixing it: ADR 81/03 replaces 81/02 with WLTP, and the Green Vehicle Guide’s fuel consumption label page says it “comes into force for new vehicles from 1 July 2026 for new vehicle models, and will apply to all applicable vehicles by 1 July 2028”.
None of it makes the gap disappear. Hold the Dolphin Premium’s measured 398 km against BYD’s own 427 km WLTP figure instead of the 490 km NEDC number the programme used, and its 19 per cent shortfall becomes 7 per cent. Better, and still short. What it does mean is that until 2028, two range figures on two brochures are not necessarily the same kind of measurement.
What electric car range Australia gives you in practice
Take the brochure number and cut it by about 11 per cent for a first estimate. That is the median of every independent Australian result so far.
Then adjust for how you actually drive, because the lab cycles assume an average somewhere between 33 and 47 km/h depending which one your car was measured under. If most of your kilometres are at 100 or 110 on a motorway, take more off. If you are doing school runs and suburban errands, regenerative braking works in your favour and you may beat the estimate.
Then work out whether it matters. A car that does a genuine 313 kilometres, which is what the cheapest Dolphin managed, still covers a 40 kilometre daily commute for a full week without plugging in. Range only becomes a real constraint on the days you leave town.
If you are cross-shopping cars that have not been tested, and most on sale here have not, the honest position is that you do not know. No electric car from Zeekr, XPeng, Chery, GWM, Geely, Hyundai, Polestar or Leapmotor has been through the route. Chery, GWM and Hyundai have had petrol and hybrid models tested, several each, but not one of their electric models. For those, the brochure figure is a claim and the 11 per cent haircut is a guess rather than a measurement. Worth raising with whoever is selling you the car. If that is Zeekr Chatswood, ask what the car does on a highway run and what they are basing the answer on.
What the measured numbers mean for a normal week
Strip out the percentages and look at the kilometres, because that is what you actually live with.
A 40 kilometre daily round trip is 200 kilometres across a working week. Every car in that table clears it on a single charge, including the worst performer, which managed 281 kilometres. Nobody in that situation is charging more than once a week at home.
The picture changes at the top end. Only three of the 20 measured over 500 kilometres: the Tesla Model Y Long Range AWD at 559, and the Kia EV5 Air 2WD Long Range and Kia EV3 Air Long Range, both at 537. Nine of the 20 measured under 400 kilometres. If you regularly do a 400 kilometre day, that halves your shortlist before you have looked at a single price.
The cars with the biggest measured range are also the ones you would expect to want a fast charger on a trip, and that is the number worth asking about alongside range. If a 7X or an X is on your list, ask what it does on a 350 kW charger, because peak charging rate decides how long a 700 kilometre day takes far more than the last 30 kilometres of range does.
Consumption is the number that costs you money
Range gets the headlines. Consumption is what turns up on your power bill, and the spread in that last column is enormous.
The most efficient car in the set is the Tesla Model 3 RWD at 140 Wh/km measured. The least efficient is the Kia EV5 Earth AWD Long Range at 219 Wh/km. That is 56 per cent more electricity for every kilometre.
Over 15,000 kilometres a year, 140 Wh/km works out at 2,100 kilowatt hours and 219 Wh/km at 3,285. The difference is 1,185 kilowatt hours a year. What that costs depends entirely on your tariff, and it is the difference between a rounding error and real money. We ran those numbers properly for Sydney electricity prices.
Two things worth noticing in that column. Efficiency does not follow price: the cheapest car tested, the BYD Dolphin Essential, is more efficient at 163 Wh/km than the BMW iX1 at 189. And efficiency does not follow accuracy either: the Dolphin Essential has the fourth best consumption figure in the set and the third worst range shortfall, because a small battery in an efficient car still runs out sooner than the brochure says.
One more thing in that data rules out the easy explanation for this whole story.
The programme publishes a laboratory consumption figure next to the measured one. Three cars used less energy per kilometre on the road than the lab said they would: the 2025 Model Y RWD at 148 Wh/km against a lab figure of 153, the 2025 Model Y Long Range AWD at 151 against 159, and the 2024 Model Y Long Range at 167 against 169.
All three still fell short on range. If real-world testing were simply capturing something a laboratory leaves out, every car would use more energy on the road, not less. Three used less and lost range anyway. The programme does not publish enough to explain that, and it is a fair question to put to it.
What to do with all this
Check whether your shortlist has been tested. Twenty cars is a small slice of the market and the results are free to read.
If it has, use the measured number, not the brochure one. If it has not, take 11 per cent off and treat that as a working estimate.
Compare consumption as well as range. A 219 Wh/km car costs meaningfully more to run than a 140 Wh/km one over a decade, and neither figure appears anywhere in a showroom.
And be careful putting two brochure figures side by side. Until 2028 one of them might be a WLTP number and the other an NEDC number, and they are not the same test. We went through what that does to one segment in our guide to the best small electric car in Australia, and stacked every cost line up against each other for mid-size electric SUVs.
Common questions
Do electric cars in Australia get their advertised range?
No. All 20 electric cars tested by the Australian Automobile Association’s Real-World Testing Program fell short of their laboratory figure, by between 3 and 31 per cent. The median shortfall is 11 per cent.
Which electric car came closest to its claimed range?
Two tied at 3 per cent: the 2025 Tesla Model Y RWD, measured at 450 km against a 466 km lab figure, and the Kia EV5 Air 2WD Long Range, measured at 537 km against 555 km.
Which was furthest off?
A 2023 MG4 Excite 51, measured at 281 km against a 405 km lab figure, a 31 per cent shortfall. MG no longer sells that variant.
Why is the laboratory figure so much higher?
Because of what it simulates. Polestar’s own explanation of the WLTP test is that it “measures the range, travelling at an average speed of 46.5 km/h in summer temperatures from a 100% to 0% state of charge”. Highway speeds, cold mornings and a sensible reserve all cut into that.
Is the range figure on an Australian brochure WLTP or NEDC?
It depends on the car, and the brochure does not always say. ADR 81/02 has applied since 2009 and accepts the figure a manufacturer declares, and manufacturers have declared both kinds. ADR 81/03, which requires WLTP, applies to new vehicle models from 1 July 2026 and to all applicable vehicles by 1 July 2028. The Green Vehicle Guide only added a field recording which procedure was used in 2026. Until that works through, check what standard a claim is quoted under before comparing two cars.
Test results in this article are published by the Australian Automobile Association’s Real-World Testing Program at realworld.org.au. Brand averages and the mean and median shortfall are our own calculations from those published results and are not figures the AAA publishes. Laboratory figures are the ADR 81/02 numbers the programme benchmarks against. Those are manufacturer-declared values and are not always the range a brand currently advertises.
Leave a Reply